
Further to my post of January 28th, which focused on Weekly charts, I'll take a closer look at near-term support and resistance levels on the shorter Daily timeframe for YM, ES, NQ & TF, as shown on the charts below.
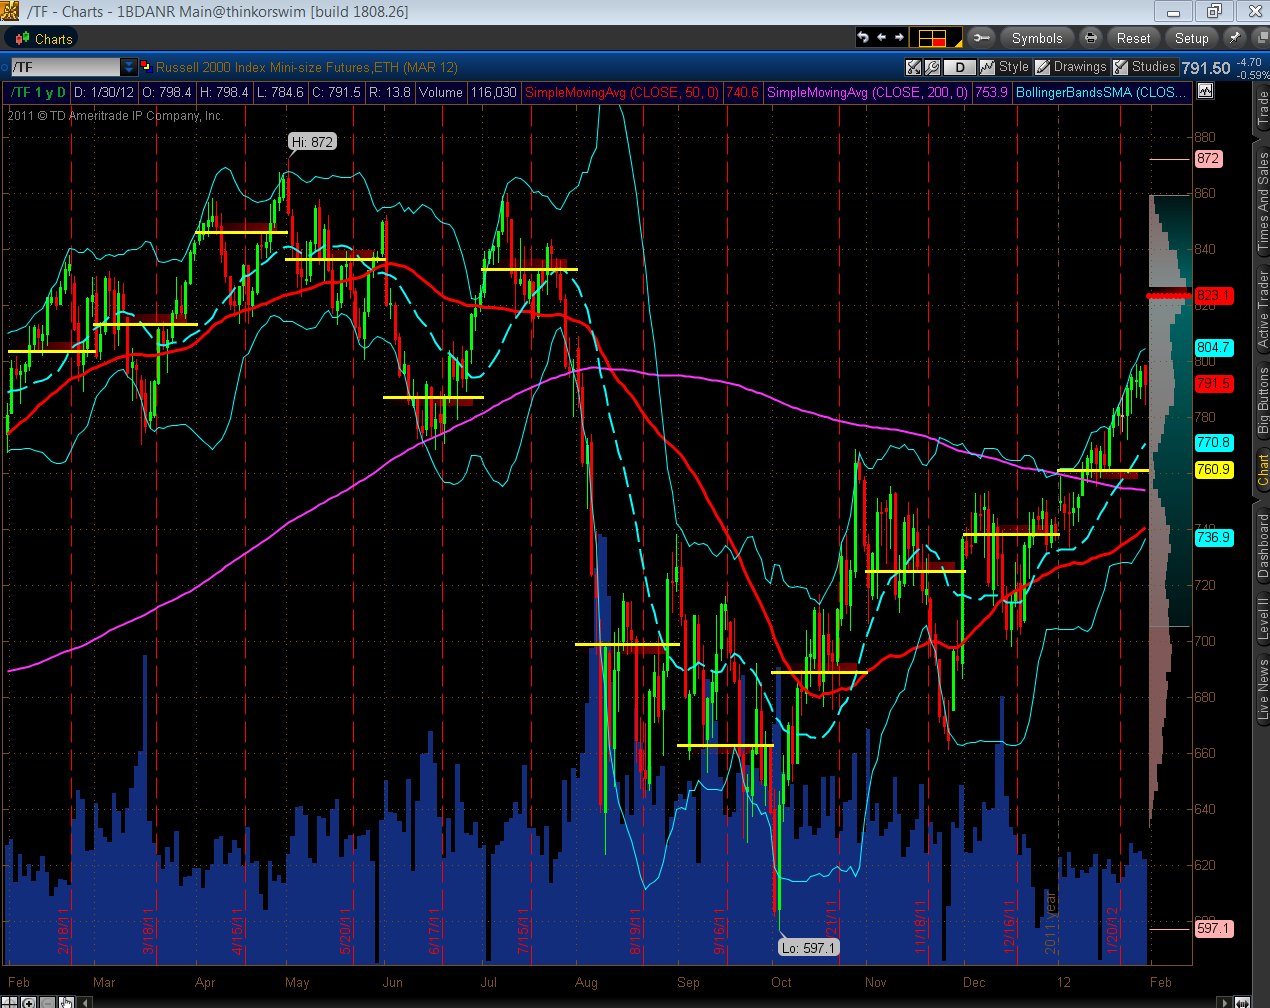
Overlayed on each chart are Bollinger Bands, monthly Volume Profile POC (horizontal yellow lines), 50 sma (red), 200 sma (pink), and a Volume Profile for the one-year period (POC is red horizontal line).
Price on YM is currently trading in between its upper Bollinger Band and middle Bollinger Band, above both POCs, and above both moving averages (which are in a bullish Golden Cross formation). Using these parameters, I'd put near-term resistance at 12761, and support at, first, 12499, then 12377, and, finally, 12195 (one-year POC).

Price on ES is currently trading in between its upper Bollinger Band and middle Bollinger Band, above the current month's POC, immediately below the one-year POC, and above both moving averages (which are are forming a bullish Golden Cross pattern as tomorrow's candle begins to form in after-hours trading…an important formation to watch for completion in tomorrow's close). Using these parameters, I'd put near-term resistance at, first, 1311 (one-year POC), then 1328, and support at, first, 1303.75, then 1297.25, and, finally, 1266.50.

Price on NQ is currently trading in between its upper Bollinger Band and middle Bollinger Band, above both POCs, and above both moving averages (which are in a bullish Golden Cross formation). Using these parameters, I'd put near-term resistance at 2493, and support at, first, 2431.75, then 2404, and, finally, 2317.75 (one-year POC).

Price on TF is currently trading in between its upper Bollinger Band and middle Bollinger Band, above its current month's POC, below its one-year POC, and above both moving averages (which are still under the influence of a bearish Death Cross formation). Using these parameters, I'd put near-term resistance at, first, 804.70, then 823.10 (one-year POC), and support at, first, 770.80, then 760.90, and, finally, its lower Bollinger Band at 736.90.
In conclusion, three important questions worth monitoring over the coming days relative to these charts are:
- Can the moving average Golden Cross that is forming in after-hours trading today remain intact on ES after tomorrow's close, and in the days ahead? (This question is pertinent to the conclusion in my January 28th post, which was that the bulls will need to focus on boosting ES higher if they are going to keep the upward momentum in play, as well as to break and hold above the major downtrend line from the 2007 highs.)
- Can TF can, ultimately, push high enough over the coming days to reverse its Death Cross to a Golden Cross, and, subsequently, push and remain higher above the one-year POC?
- Can bulls maintain price above the current month's Volume Profile POC on all four e-mini futures indices, particularly as February's trading action commences on Wednesday, in order to, potentially, keep this rally moving up to form a higher monthly POC for February?
http://www.strawberryblondesmarketsummary.com/
