
I've been noting the H&S forming on ES / SPX for a couple of days but I was surprised to see it break down yesterday. That throws the double-bottom into doubt on much more downside. Short term I have a possible falling wedge on SPX and a break above 1396 would look bullish. The H&S target is in the 1373 SPX area and if SPX gets below 1384 today then that may well be hit:

I say 1384 SPX as support as there is a cluster of support in the 1384-6 area today. The middle bollinger band on the daily is at 1384, 85s are generally important on SPX, and the 50DMA is at 1386. If we see an hourly close below 1384 that will therefore look significantly bearish:

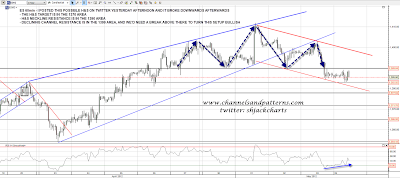
On ES I have a small declining channel which has hit support and is showing marked positive divergence on the 60min RSI. It could bounce here. Channel support is at 1381 which fits with 1384 support on SPX, neckline resistance is at 1390, and declining resistance from the high is at 1399, though the declining resistance on SPX at 1396 is a lower and most likely better level to watch:
It's important to remember here that the double-bottoms that are now in trouble on multiple indices were not the only patterns that broke up the other day. There was also the broadening descending wedge on NQ which is a higher probability pattern with a 79% probability of making target. The retest of broken wedge resistance would be in the 2680 area today, and I have another little declining channel there which has hit support on positive RSI divergence. Again, we might see a bounce on NQ:

My anti-USD trade proxy GBPUSD broke over the October high at 1.6163 the other day and that level is now support. GBPUSD has been testing that support so thoroughly that it has formed a little H&S with a target in the 1.601 area on a break below 1.6163. The obvious target would however be rising support from the January low in the 1.594 area today:

Overall I'm somewhat bearish biased today and will get more bearish on an hourly close below 1384 SPX. I'll get less bearish if SPX breaks over 1394 and will be leaning bullish on a break over 1396. The support and resistance levels today are nice and clear and a break either way should be respected. If SPX doesn't close an hour below 1384 I'll be regarding the double-bottom setups as weaker but still in play. Obviously the jobs figures at 8.30 may be a big market mover today so direction may already have clarified by the open.
