The sectors feature is available to Silver, Gold, and Platinum users. You can upgrade your membership to get immediate access by clicking here.
SlopeCharts has access to information about nearly 500 different industry sectors, and you can put this information to work to filter your watch lists based on choosing any sectors you want. For example, you might want to look at all the stocks in the S&P 500 related to retail. You also also examine all the individual stock tickers within each specific sector.
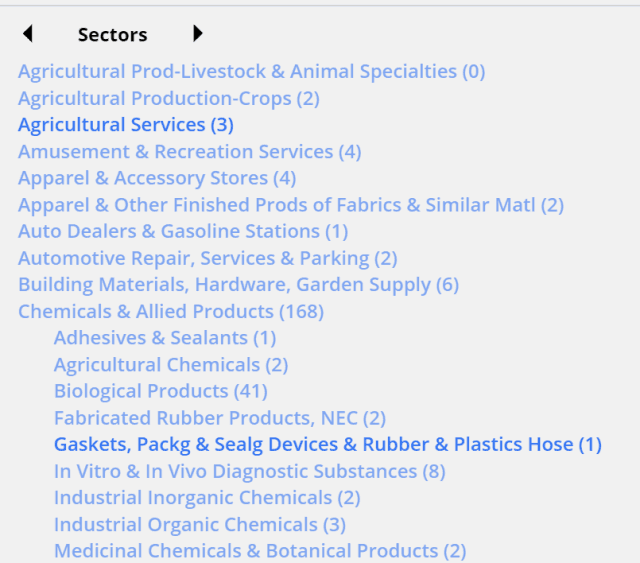
There are a couple of ways to make use of the Sector data. One is to refer to the left panel of the SlopeCharts platform and, after choosing the Sectors data panel (which you access by clicking on the left or right arrows) you can explore the sectors and sub-sectors within.
The ticker symbols themselves are organized within these lists, and you can copy any specific symbol to one of your own watchlists. If you want to return the list to its original state, click on the Sectors title at the top and choose Collapse All from the popup menu.
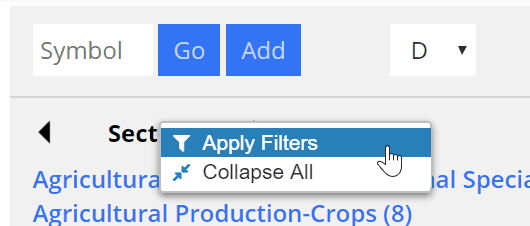
You can make your exploration of sectors much quicker by doing some filtering. Click on the Sectors header and choose Apply Filters:
You will be presented with a dialog box which you can use to constrict the kinds of symbols that are displayed. You can narrow the list based on price, volume, or whether or not the symbols in your own watch lists should be excluded from the sectors ticker symbols. After you apply the filters, the quantity of tickers will be smaller, and affected sectors will be displayed in a lighter color to make clear that some of the contents have been excluded.
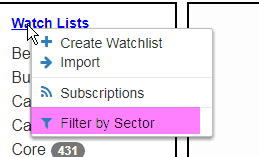
If you want to filter your own watch lists based on sectors, click the Watch Lists header and choose Filter by Sector:
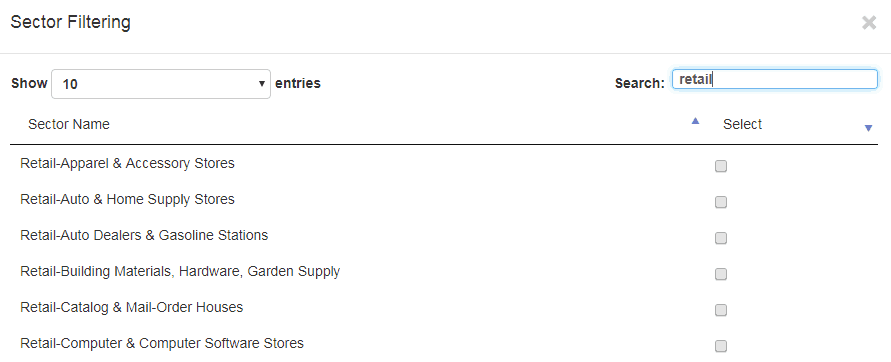
You can scroll through the sectors (in alphabetical order) or search based on any text. For instance, by typing in “retail”, you can see any of the sectors with the word “retail” anywhere. You can check any of these, or to save time, you can click the Select All Shown button to checkmark every single sector displayed. When you are done with your choices, click the Apply button.
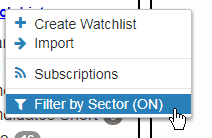
When you are doing any filtering, the menu changes to indicate that filters are on (otherwise, all symbols are displayed in the watch lists):
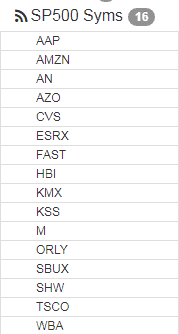
All of your watch lists will benefit from the filtering. For example, if only “retail” sectors are chosen for the S&P 500 watch list, the list shrinks from 500 down to 16.